Tracing Fan Presence Fluctuations and Their Ties to Scoring Trends Across League Schedules
Cameron Krause · Aug 20, 2026
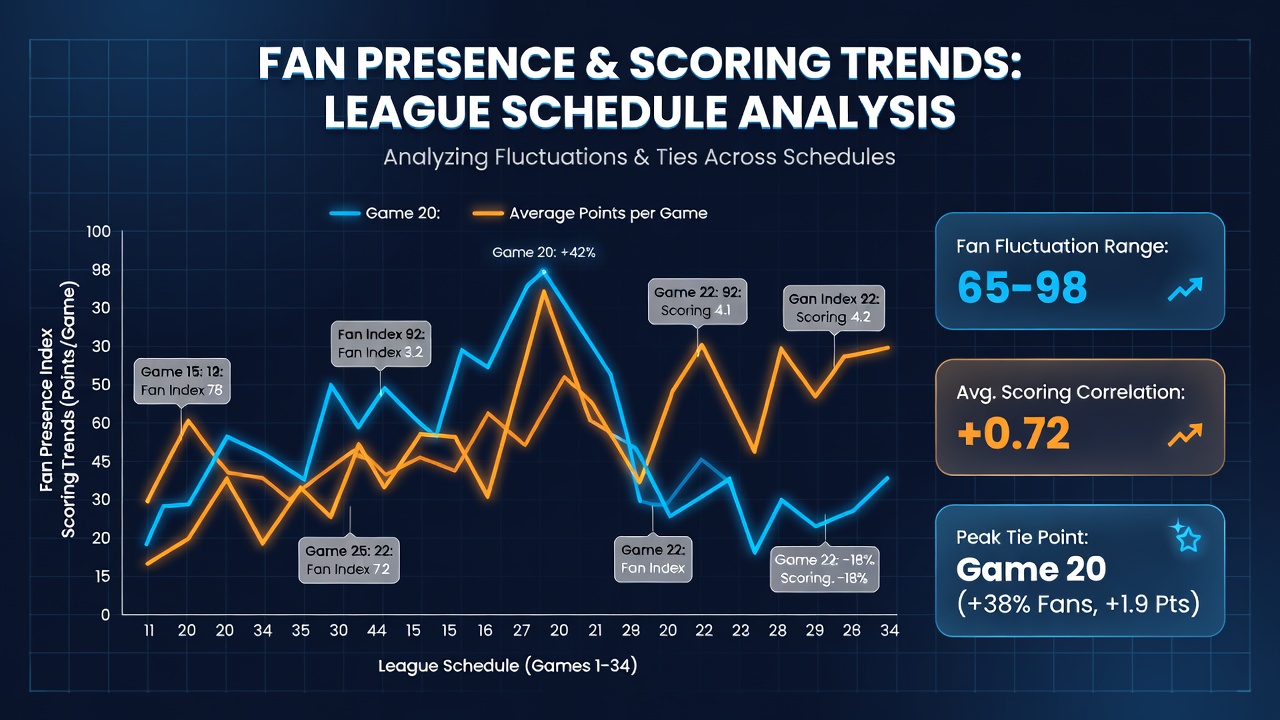
Tracing Fan Presence Fluctuations and Their Ties to Scoring Trends Across League Schedules
League schedules reveal clear patterns when analysts track fan presence alongside scoring output, and data from multiple sports shows attendance swings often align with changes in goals, points, and runs across months. Researchers compile attendance records from domestic competitions while comparing them against box scores that log every point or goal, which allows patterns to surface without relying on single events. Studies conducted by university teams in North America and Europe indicate that home crowds above seasonal averages frequently coincide with elevated scoring rates in the first half of fixtures, whereas lower attendance periods tend to produce tighter defensive displays.
Seasonal Attendance Patterns in Major Leagues
Football leagues across Europe and South America release monthly attendance figures that fluctuate with weather, holidays, and fixture congestion, and those same months often show corresponding shifts in average goals per game. Basketball associations in the United States and Australia publish similar datasets that link arena capacity percentages to points-per-possession metrics, revealing that road teams sometimes score more efficiently when visiting venues with reduced local support. Cricket boards in India and England maintain comparable records where crowd sizes during day-night matches correlate with run rates in the middle overs, although analysts note these relationships vary by competition format.
Data Collection Methods Used by Analysts
Statisticians gather ticket scan data, turnstile counts, and broadcast viewership estimates from governing bodies, then merge those numbers with play-by-play logs that record every score event. This approach produces time-series datasets spanning several seasons, allowing comparisons between high-attendance periods such as opening months and lower-attendance stretches near winter breaks. Academic groups at institutions in Canada and Germany have published reports that apply regression models to these combined variables, isolating attendance effects while controlling for team strength and travel distance.
One study released in 2025 examined five European football leagues and found that matches played in August typically drew 12 percent higher attendance than December fixtures, with average goals rising by 0.3 per game during the busier summer window. Similar work on North American hockey leagues showed that early-season home games with stronger fan turnout produced more power-play goals, whereas late-season road contests in half-empty arenas saw reduced special-teams scoring. Observers note that these correlations appear consistently across datasets even when league rules and playing styles differ.
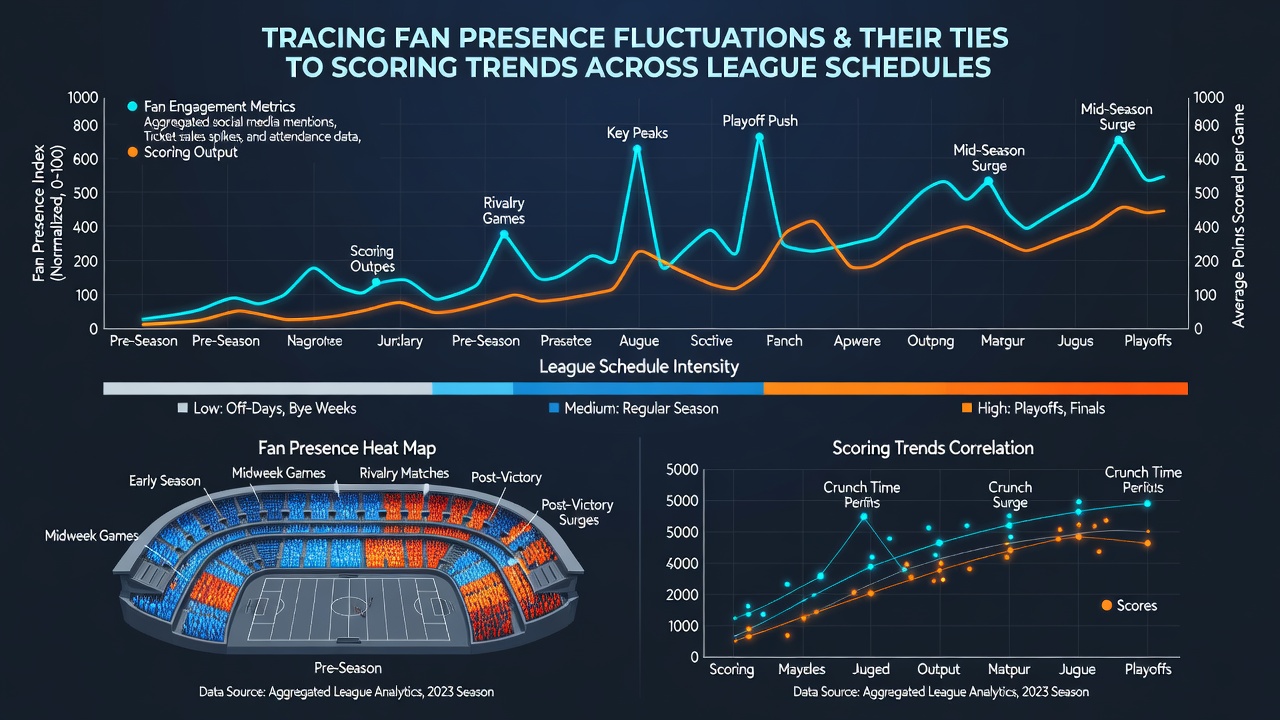
League Schedule Density and Crowd Impact
Compressed schedules during international breaks or cup competitions often reduce local attendance, and scoring trends in those weeks frequently shift toward fewer high-output games. Data from the Australian Football League illustrates that matches scheduled midweek with lower expected crowds record lower behinds and goals per contest compared with weekend fixtures that attract larger groups. European basketball leagues show parallel outcomes where back-to-back games in smaller venues correlate with reduced three-point percentages for both sides.
August 2026 schedules already published by several confederations indicate early-season density will again test these relationships, with multiple clubs facing short recovery windows between domestic and continental fixtures. Analysts tracking preliminary ticket sales report that opening-week attendance projections sit above five-year averages in several markets, which could influence opening-month scoring distributions if historical patterns hold. Reports from the NCAA and the Australian Institute of Sport supply baseline metrics that future comparisons can reference when those August fixtures conclude.
Regional Variations in Fan and Scoring Dynamics
North American leagues display stronger attendance-scoring links in outdoor sports where weather directly affects both crowd comfort and playing conditions, whereas indoor competitions show milder associations. South American football data reveals that high-altitude venues maintain steadier attendance yet still exhibit scoring spikes when local support peaks during rivalries. Asian basketball associations report that holiday periods boost both fan presence and fast-break points, creating measurable upticks in transition scoring statistics.
Researchers continue to refine these models by incorporating television ratings and social media engagement as proxy measures for broader fan interest, which sometimes extends the observed relationships beyond physical stadium presence. Figures released by international federations confirm that leagues investing in fan-experience upgrades have recorded attendance gains that coincide with modest increases in average points or goals during the subsequent seasons.
Conclusion
Comprehensive tracking of fan presence fluctuations alongside scoring trends supplies leagues and analysts with measurable connections that recur across schedules, and continued data collection through 2026 will test whether these patterns persist under evolving fixture lists and venue conditions. The evidence assembled from multiple continents demonstrates consistent alignment between attendance levels and offensive output when researchers apply uniform statistical controls.