Packed houses and empty stands: measuring how spectator turnout reshapes scoring patterns in basketball arenas and soccer venues
Cameron Krause · Jul 26, 2026
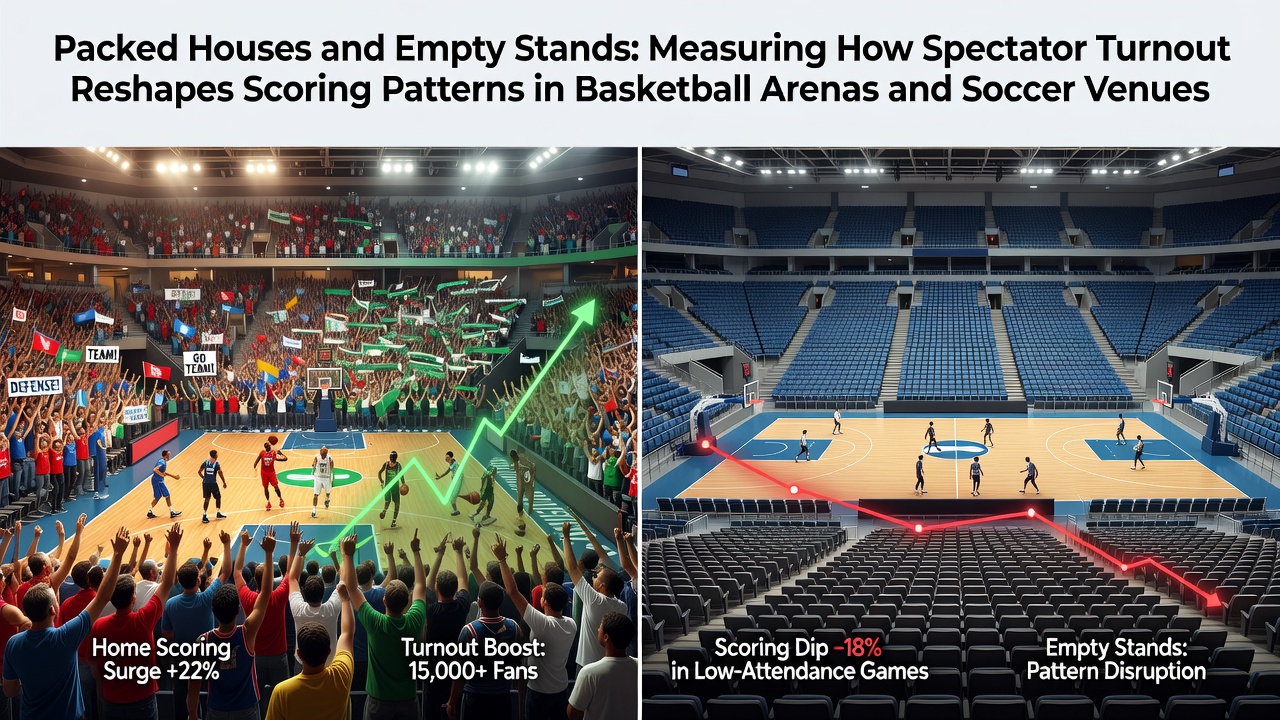
Packed houses and empty stands: measuring how spectator turnout reshapes scoring patterns in basketball arenas and soccer venues
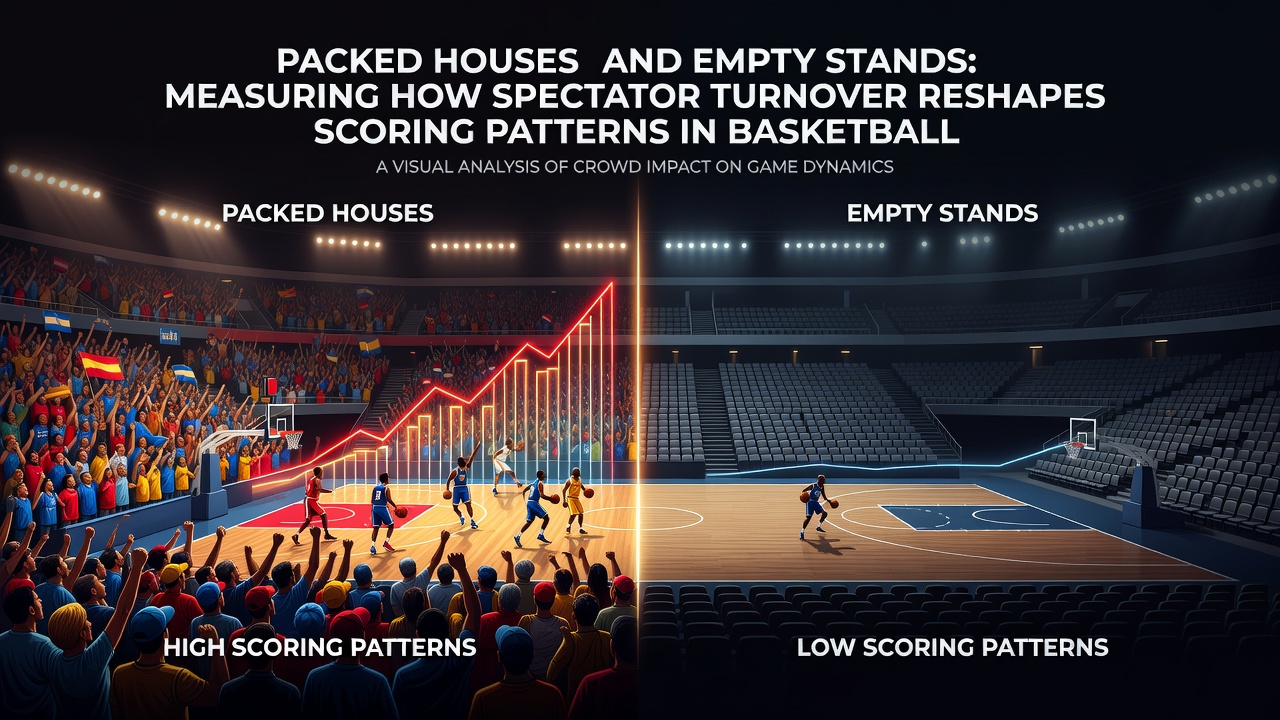
Stadium attendance figures directly correlate with measurable shifts in scoring across both basketball and soccer, as researchers track points per game and goal tallies under varying crowd conditions. Data collected from multiple leagues shows that full venues tend to boost home team output while suppressing visitor performance, whereas empty stands produce more neutral distributions that flatten traditional advantages. Analysts compile these patterns through box scores and advanced metrics, revealing consistent trends that hold across seasons and competitions.
Basketball scoring adjustments in occupied versus vacant arenas
Professional basketball leagues record higher home team field goal percentages and three-point volumes when arenas reach capacity, with studies from the NCAA indicating an average increase of 4 to 6 points in total home output during sold-out games compared to limited-attendance contests. Road teams meanwhile post reduced assist-to-turnover ratios under the same packed conditions, as crowd noise disrupts communication and forces quicker decisions that lead to turnovers. Researchers at institutions across North America have documented these effects through longitudinal datasets spanning regular season and playoff matchups, noting that the gap narrows significantly once attendance drops below 50 percent of capacity.
July 2026 schedules already incorporate expanded analytics tracking for several conferences, allowing real-time comparison of scoring runs in venues operating at different occupancy levels. Teams playing in front of capacity crowds convert second-chance opportunities at higher rates, while the same squads show no such elevation during neutral-site or low-attendance events. Observers note that free-throw accuracy remains relatively stable regardless of crowd size, yet defensive rebounding percentages for home units climb measurably when stands fill, contributing to extended possession stretches and higher overall point totals.
Soccer goal patterns tied to spectator density
European and South American soccer competitions demonstrate parallel shifts, where full stadiums elevate home goal rates by roughly 0.3 to 0.5 goals per match according to aggregated match reports from continental federations. Empty or sparsely attended venues during recent health-related restrictions produced lower-scoring affairs overall, with away sides maintaining cleaner defensive records and fewer concessions from set pieces. Midfield transition metrics reveal that home teams generate more entries into the final third when supporter volume increases, directly feeding higher expected goal values calculated by tracking providers.
Analysts cross-reference attendance logs with event data from governing bodies such as those operating under Australian sports frameworks and Canadian league archives, confirming that crowd density influences referee decision tendencies on fouls and cards in ways that indirectly affect scoring windows. Home sides earn more attacking free kicks in packed environments, leading to additional goal opportunities from dead-ball situations. These patterns persist across domestic leagues and international tournaments, though the magnitude varies by competition intensity and fixture timing.
Quantitative methods for assessing turnout effects
Statistical models now incorporate attendance percentages as continuous variables alongside traditional factors like travel distance and rest days, producing regression outputs that isolate crowd influence on both total goals and points scored. University research groups in multiple regions apply mixed-effects frameworks to separate venue-specific noise from broader seasonal trends, yielding coefficients that quantify how each incremental rise in occupancy alters expected scoring margins. Video analysis supplements these numbers by coding player reactions to auditory cues, documenting shorter decision windows and altered positioning when stands generate sustained volume.
League databases from North American and European sources supply the raw play-by-play files required for such modeling, while industry reports from trade associations aggregate findings across basketball and soccer to highlight cross-sport consistencies. The resulting coefficients show stronger crowd effects in indoor basketball settings than in open soccer stadiums, yet both sports exhibit home scoring uplifts that scale with attendance density. These measurements enable precise forecasting adjustments that account for projected turnout rather than assuming static venue advantages.
Conclusion
Attendance data continues to refine understanding of scoring dynamics in basketball arenas and soccer venues, with empirical records demonstrating clear, quantifiable impacts on offensive output and defensive efficiency. Continued collection of granular metrics through 2026 and beyond supports ongoing calibration of these models across different leagues and regions.