Linking Travel Distances to Squad Rotation Patterns for Multi-Bet Edges
Alex Jung · Jul 16, 2026
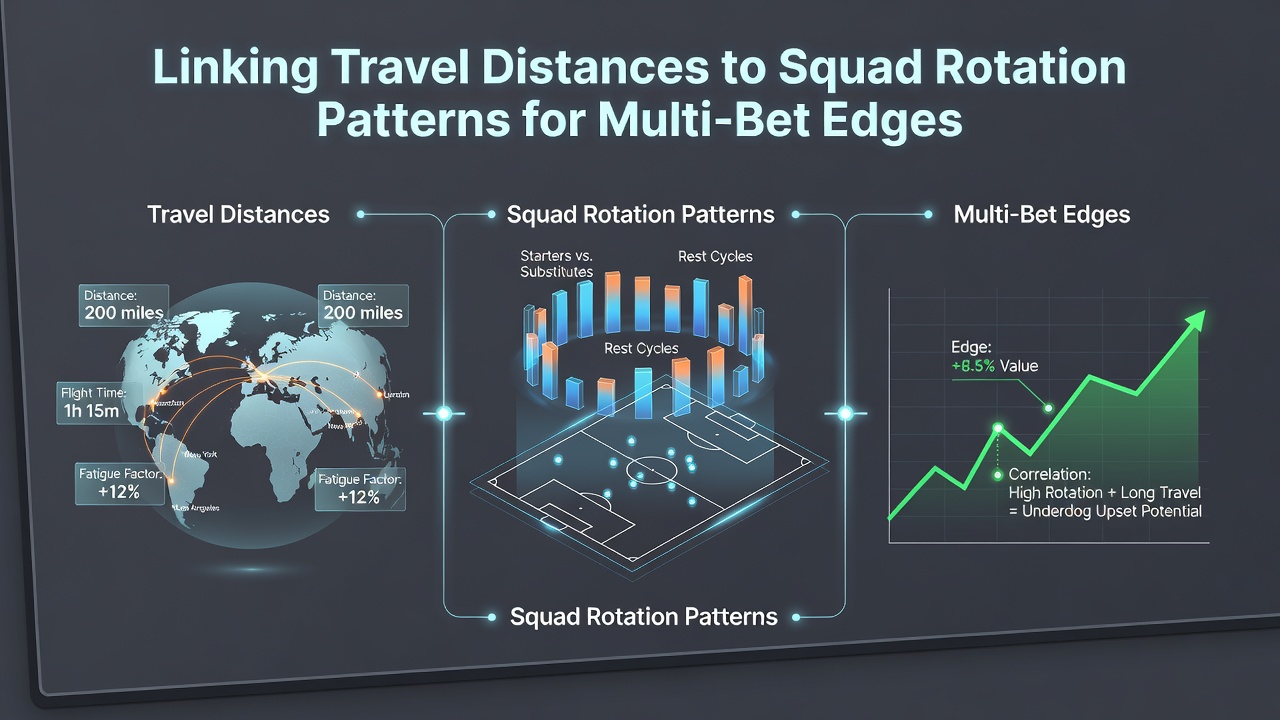
Linking Travel Distances to Squad Rotation Patterns for Multi-Bet Edges
Travel distances in professional sports create measurable effects on player performance while squad rotation patterns offer teams ways to manage those effects. Data from multiple leagues shows that longer journeys correlate with changes in key metrics such as sprint distance covered and pass completion rates, and researchers track these variables to identify patterns that influence match outcomes. Observers note that when clubs schedule extended trips without adequate recovery periods the resulting fatigue often appears in reduced high-intensity efforts during the second half of games. Studies from the Australian Institute of Sport indicate that teams covering more than 1,500 kilometers in the 72 hours before a fixture experience average drops of 8 percent in total distance run compared with well-rested sides. Those figures become relevant for bettors constructing multis because they help isolate fixtures where one side holds a hidden physical edge.Travel Metrics Across Different Leagues
European domestic competitions feature varying travel demands depending on geography and scheduling. In the Bundesliga for instance clubs in the south often face longer rail and flight combinations when visiting northern venues during winter months. NBA schedules meanwhile produce coast-to-coast trips that exceed 4,000 kilometers in a single week for some franchises. Figures released by league offices reveal that back-to-back games following such journeys show visiting teams winning roughly 6 percent less often than their season average.
Rotation decisions interact directly with these travel loads because coaches adjust lineups to preserve key players after demanding trips. Performance analysts examine minutes played by starting elevens in the preceding four matches to gauge whether a side is likely to field a fresher group. When travel distance exceeds typical thresholds and rotation rates remain low the data frequently points to predictable dips in attacking output and defensive organization.
How Rotation Patterns Offset or Amplify Travel Effects
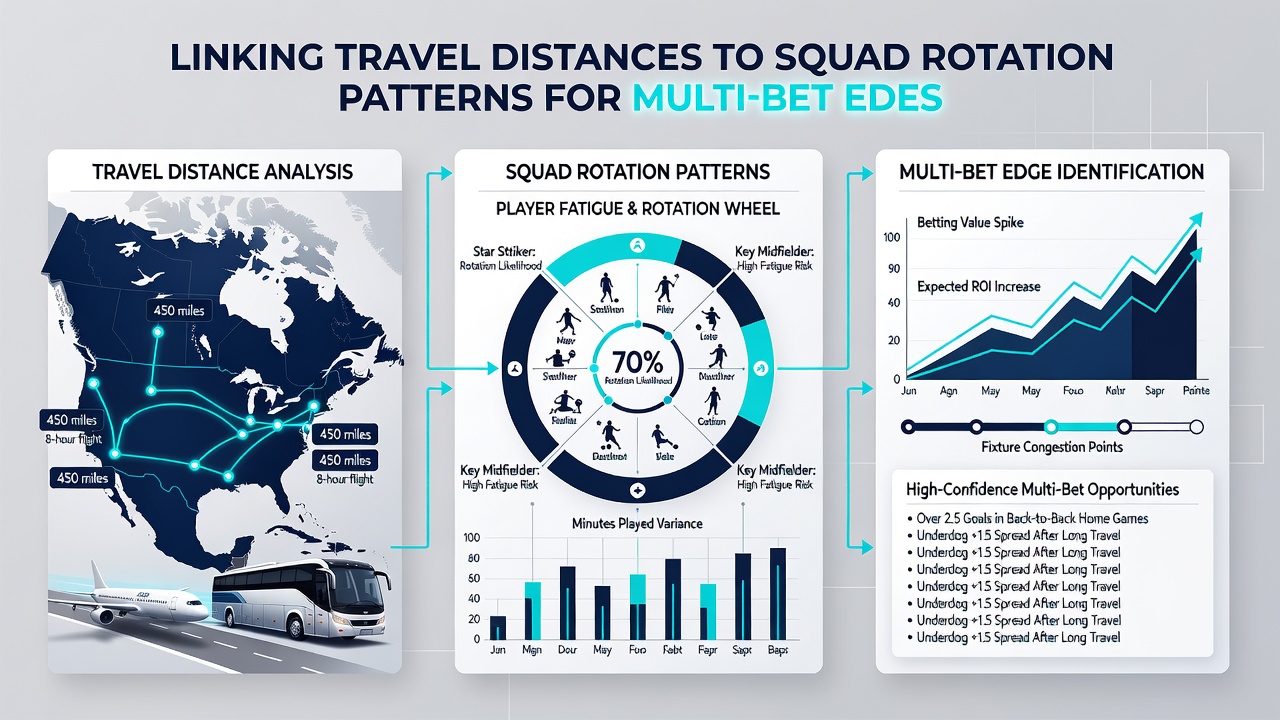
Coaches in top divisions rotate players at different rates depending on fixture congestion and squad depth. A midweek cup tie followed by a long-haul league away game often prompts changes in central midfield and full-back positions where physical demands peak. Research published by the University of Queensland’s School of Human Movement and Nutrition Sciences demonstrates that sides rotating at least three outfield players after journeys longer than 800 kilometers maintain higher average work rates in the subsequent fixture.
Conversely limited rotation after moderate travel sometimes produces elevated foul counts and reduced duel success rates because fatigued athletes commit more errors under pressure. Bettors monitoring both variables can combine them into multi-leg wagers that target markets such as total corners or player assists where the underlying physical data shows clear directional tendencies.
Building Multi-Bet Edges From Combined Data
Accumulators gain reliability when selections incorporate both travel distance thresholds and verified rotation percentages rather than relying on form alone. One approach involves filtering fixtures where the away side has covered at least 1,200 kilometers since its last match yet has rotated fewer than two starters from its most recent starting lineup. Historical datasets covering the 2024-2025 and 2025-2026 campaigns show these conditions produce underperformance in expected goals created by roughly 0.35 per game on average.
July 2026 schedules already released by several confederations highlight clusters of long-distance pre-season tours that will feed directly into early domestic rounds, giving analysts fresh datasets to refine these filters before the new campaign begins. Cross-referencing those tours with probable rotation announcements allows construction of multi-bets that isolate value in both team totals and individual prop markets.
Practical Application in Different Sports
Football and basketball provide the clearest examples because both sports publish granular tracking data and release confirmed lineups hours before kickoff. In football leagues with continental commitments the overlap of European travel and domestic fixtures creates repeated test cases each month. NBA back-to-back sets after cross-country flights offer similar opportunities where rotation minutes from the previous game become predictive of three-point volume and defensive rating.
Those who compile historical travel logs alongside official lineup submissions often identify recurring edges in specific prop categories such as goalkeeper saves or rebound totals that align with elevated fatigue markers. The method remains consistent across codes even though absolute distances differ.
Conclusion
Linking travel distances to squad rotation patterns supplies a factual framework for constructing multi-bet selections grounded in measurable performance variables. League data and academic studies continue to document the interactions between these factors while upcoming 2026 schedules will supply additional test cases for refinement. Bettors who integrate verified travel metrics with rotation percentages gain access to edges that rest on documented patterns rather than subjective impressions alone.