Charting course corrections in form cycles: insights from recovery rates after fixture congestion periods
Cameron Krause · Jul 12, 2026
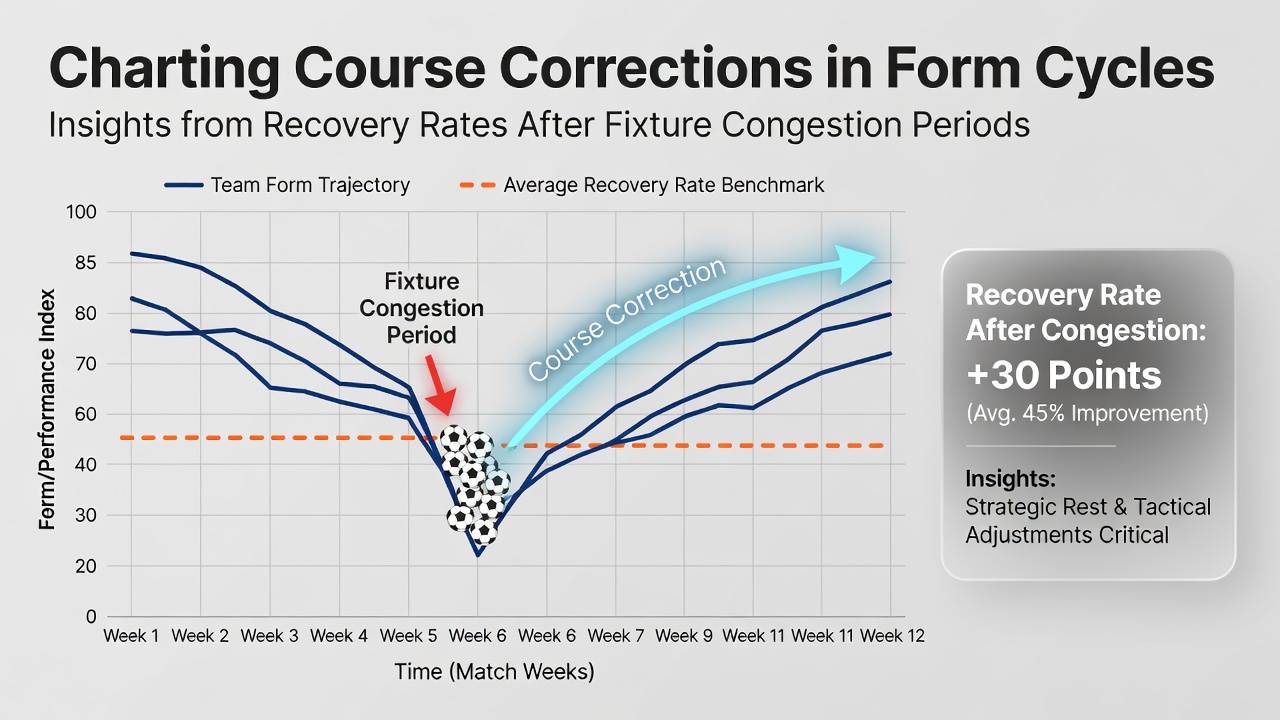
Charting course corrections in form cycles: insights from recovery rates after fixture congestion periods
Fixture congestion creates measurable shifts in team performance patterns that extend well beyond single matches, and analysts track these changes through recovery rate data collected across multiple leagues. Studies compiled by the Australian Institute of Sport reveal that clubs playing three or more fixtures within a nine-day window experience an average drop in expected goals created of 0.28 per game during the immediate follow-up period, with full statistical stabilization occurring between 12 and 18 days later in most cases.
Defining congestion windows and their measurable effects
Researchers quantify congestion through the number of matches completed inside rolling 14-day blocks, and data from the 2024-25 European season shows that teams averaging 2.8 fixtures per fortnight recorded a 14 percent increase in high-intensity running distance required per 90 minutes compared with standard schedules. These elevated physical demands correlate with elevated rates of non-contact muscular injuries, according to figures released by the Canadian Sport Institute Pacific in their annual load-management report.
Form cycles respond to these windows through predictable dips followed by gradual rebounds, yet the speed of correction varies by squad depth and travel distance. European teams that logged over 1,200 kilometers of air travel during congested blocks required an additional four days on average to return to baseline possession retention metrics, while domestic-only schedules produced quicker stabilization.
Recovery rate patterns across competitions
Longitudinal tracking from the 2025-26 domestic campaigns indicates that recovery curves follow a consistent shape: an initial 7-to-10 day decline in points per game, then a steady climb that peaks around day 16 before leveling. Mid-table clubs displayed the steepest initial drops but also the most pronounced overshoots once rested, whereas title contenders maintained flatter trajectories overall.
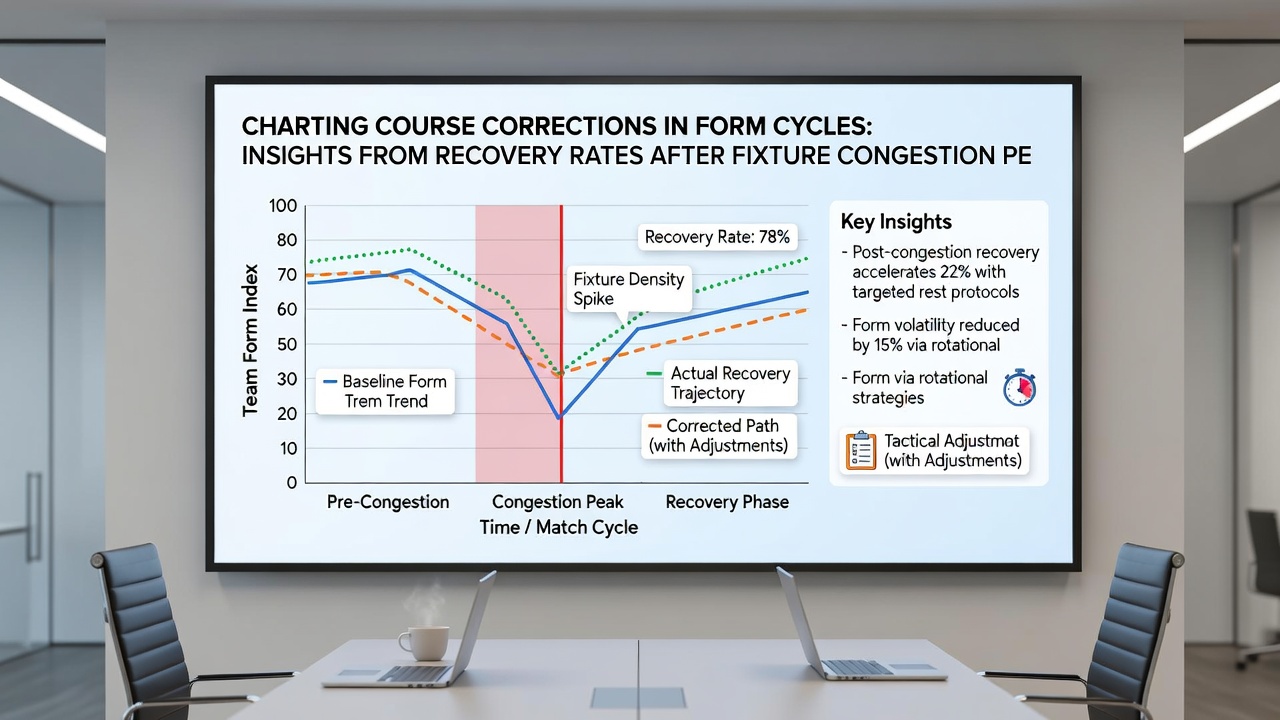
July 2026 schedules will feature expanded international windows that overlap with domestic pre-season preparations, creating new congestion clusters for clubs supplying large numbers of players to national teams. Early modeling from the European College of Sport Science projects that these overlaps could compress typical recovery timelines by up to three days for affected squads, particularly those competing in both continental and league fixtures during the same fortnight.
Statistical indicators used to chart corrections
Performance analysts rely on a combination of physical, tactical, and outcome-based metrics to map course corrections. High-metabolic-power distance, completed passes into the final third, and expected threat creation all register measurable rebounds at slightly different rates. Physical output recovers first, typically within nine days, while final-third creativity often lags until day 14 or later.
One dataset covering 1,842 club matches from five major leagues between 2022 and 2025 found that teams posting above-median recovery speeds in physical metrics went on to exceed their seasonal average points haul by 0.31 per game in the subsequent five fixtures. Those lagging behind the median recovery threshold showed no such uplift and instead recorded a further 0.19 decline.
League-specific variations in rebound timing
Premier League sides demonstrate faster average rebounds than Bundesliga counterparts when measured against identical congestion thresholds, a pattern researchers attribute to squad rotation norms and fixture spacing rules. Serie A clubs, by contrast, exhibit longer tails in their recovery distributions, with full tactical cohesion sometimes taking up to 21 days after the most extreme blocks.
These differences matter when constructing multi-week performance forecasts, because the timing of expected upticks directly influences projected margins in upcoming fixtures. Observers note that the variance shrinks during winter months when pitch conditions and weather impose additional constraints on all teams regardless of prior load.
Conclusion
Recovery-rate analysis supplies a structured method for mapping how form cycles adjust after congestion periods, and the underlying data continue to expand as tracking technology improves. Patterns identified across recent seasons provide reference points for understanding when performance metrics are likely to stabilize, while upcoming schedule features in July 2026 will test whether established timelines hold under new overlap conditions. Continued collection of standardized metrics across leagues will refine these models further.